Learning Resources

Article Review - Intraday Path Length | Kim Zussman

While rummaging through the http://www.dailyspeculations.com/ blog some time back, I landed on this gem.

Just read it. Re-read it, and try adapt it to NIFTY, you would see immense value in it.  I've always intuitively used the concept of "Path Length" in my trading, didn't know its something which the biggies also look at.

http://www.dailyspeculations.com/wordpress/?p=2507

http://www.dailyspeculations.com/wordpress/?p=2507

What I learnt from Victor Neiderhoffer | Article Review

I have been a fan of Victor Niederhoffer for a long time. What a talented multifaceted man. If you are into trading or any kind of speculative business you've got to read his books.

I read this (https://www.newyorker.com/magazine/2007/10/15/the-blow-up-artist) article about him and thought of sharing some interesting snippets.

1. Experience in some sort of Performance Sport - I do think it helps to have had played a sport or done any performance related thing like Music etc. The reason I think its relevant is from a skill development perspective. All forms of sports or crafts require a progression of skill levels. It also requires us to observe, reflect, deconstruct, attempt and practice tasks. 

Capture_1-Sport.PNG

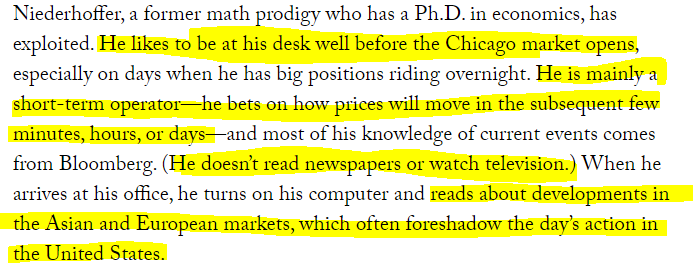
2. Discipline, avoiding noise and focusing on Short term moves - Being on time I guess is the first aspect of discipline, alludes to the idea of routines and their importance in success. The second aspect is avoiding noise, as a trader you need to have confidence in your system and approach and you need to avoid noise i.e informational noise. Thankfully I quit TV a decade back, and have never gone back. Lastly, look at that focus on "Short term moves". I have always been against the Random Walk/Fama school, and have been more of a Mandelbrot follower. Good to see the same beliefs at play here. 

Capture_2-Trading Style.PNG

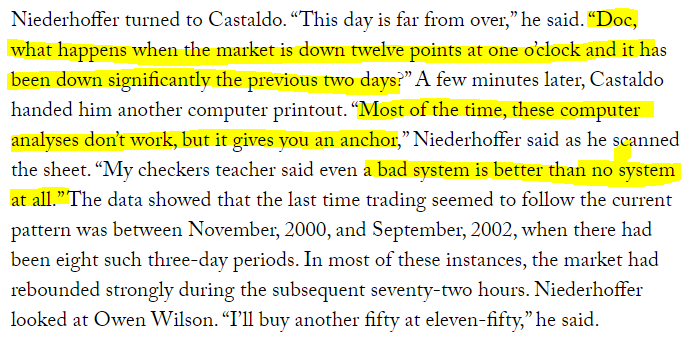
3. Market Statistics as an Anchor - It always helps to know how things worked in a similar context in the past. The reason it helps is because prices in the short term are nothing but a reflection of the emotions of people, and that does not change.

Capture_3-Trading Style_Statistics.PNG

4. I told you so! If someone tells you that day trading does not work, its because most traders do not have the skills to make it work, but by itself patterns in shorter periods are far easy to predict than in longer periods.

Capture_4-Trading Style_shortterm predictability.PNG

5. RIP - Efficient Market Hypothesis and Random Walk Theory - The moment you shorten your trading time frame, you will start to see the inefficiencies. If you are a trader reading this, think about Open Close as a separate event and High Low range formation as a different event, and you will see the inefficiencies clearly.

Capture_5-against RMH.PNG

Lastly, understand where risk comes from, I mean risk of ruin. While there is always a defined risk with which we take trades, risk of ruin typically comes from the possibility of an unforeseen event happening and you having no control over it. Read that statement again, the second part especially.

Now think about how to avoid being in that situation, that should be good enough to keep you going in this business.

Happy Trading!

Scalping as a Skill | How to Practice Deliberately

If you look at learning to Scalp - It has three components to it - Knowledge, Skills and Attitude. While Knowledge is something which is relatively easy to pick up, and may not take much time, its the other two components that take more time. Like any other skill, practice is an important component of it. You need to trade for a long period of time to gain expertise. 

One of the reasons why "Scalping" experience is preferred in several Prop Desks, Arcades and Trading Desks, is because Scalping is one way of accelerating the learning cycle by trading more. Yes it may seem counter intuitive to some, but think about it. The act of identifying levels and punching in orders, multiple orders sometimes, modifying them, and doing all this in an emotionally charged environment, not easy. Scalping helps you desensitize yourself from these emotional highs and lows as you would get to expose yourself to it several times in a day. This is the point where practice starts influencing your personality and attitude. 

I don't know of any successful trader who has not been though this cycle.  

But more importantly one has to structure ones practice. This video helps us understand the idea of deliberate practice better. Do watch it till the end, almost everything shared in the video is applicable to the world of trading and scalping.

Dissecting Momentum | NIFTY Intraday Scalping

One of the turning points in my trading journey was the time when I stopped predicting direction. It doesn't come easily and naturally. Needs a bit of conditioning but once you get through it, your cognitive algorithm works like a charm. It moves from a binary to a bayesian mode. 

Let me illustrate the two ways of thinking and how it manifests in the words that we use.

Trader 1 - Oh it has moved beyond this level now its not going to come down, its going to continue in that direction itself.

Trader 2 - The price may go up or down, if it goes up it should go till this point, and if it goes down it should go up till this point.

Notice the difference in thinking. Trader one is thinking in more or less a Binary way, there is no nuance there. Trader 2 is bayesian according to me. Because there are multiple outcomes each specified with a different confidence level. 

Let see how this can be applied to scalping 

Look at Figure 1 below. This is a 1 minute TF chart with the Green Line being the VWAP. Look at the last few candles, where do you think the price is headed? Obviously looks as if its going down.

Figure 1

Figure 1

This is a 1 minute TF chart with the Green Line being the VWAP. Look at the last few candles, where do you think the price is headed? Obviously looks as if its going down. Now look at Figure 2 below.

Figure 2

Figure 2

Such shifts are part of everyday price action, the only way to deal with them is to define "Trade Validation/Invalidation Levels"

That brings us to the topic of Momentum. Momentum has two parts to it a) Direction b) Speed. When scalping you cannot predict direction. What you can do is to take a probabilistic call on two things 1) Possible extent of move from a given reference point. ( This needs to be arrived at based on back-testing) 2) Volatility - Which is similar as 'speed' of the move. (Which again can be arrived at by back-testing for time intervals with high volatility)

In this case VWAP would be your reference level, the points marked in red (Figure 2) would be points of validation or invalidation depending on the direction that you are trading. Based on which you would also have to create a Risk Reward ratio to trade in such locations.

So the idea of this post was to explain why its futile to predict direction, instead its better to go with the probabilities and bank on volatility to get you to your targets. 

Also remember there are times when price would get to the point of validation and invalidation and still may reverse from there, what do you do then, I will leave it for another day.

Happy Trading!

Understanding NIFTY Market Structure | Time of Day

In continuation with the previous article about NIFTY Volatility based on time of day, here is another simple way of understanding the market structure of NIFTY.

Previous article - https://www.niftyscalper.com/blogs/2017/8/8/article-excerpt-niftyscalper-data-analysis-fundamentals-of-short-term-trading-part-two-dr-brett-n-steenbarger

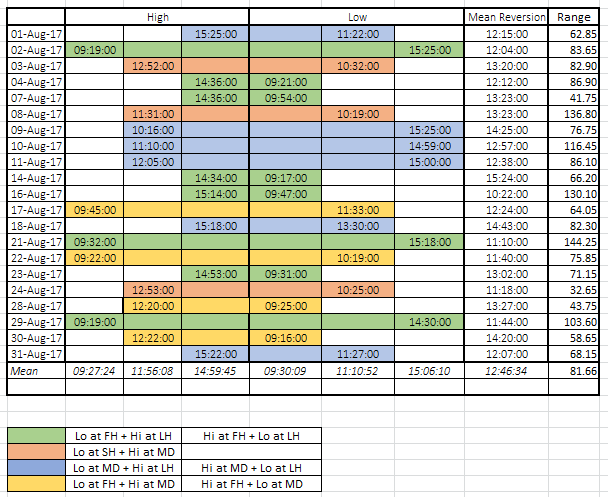
You can create a simple excel sheet to capture the following details, Time stamp for - High, Low, and Mean Reversion of the day. I have categorized time as 1st hour (FH)/last hour (LH) and Mid Day (MD). You will see a pattern here, and over time you may be able to internalize this pattern.

 As an Intraday trader I am direction agnostic here, and as you can see there are only 4 types of days. And yes for the best part, look at the Mean Reversion column, it speaks for itself.

xl.PNG

Combining this with NIFTY Range probabilities should help you improve your ability to make short term forecasts of market direction.


Book Review - High Profit Trading Patterns by Kora Reddy

For a while I have been on the lookout for a book on Indian Indexes. Recently a fellow trader recommended this book and I thought of giving it a read. Thanks to my dyslexia I am not a big reader of books, but given that I didn't have any choice here, I thought of reading it.

Before I share my thoughts on the book here are a few excerpts from the book which resonated with me.

1.jpg

I only wish people understand this fact about indicators. 

2.jpg

As Larry Williams says, patterns form because of the way humans/human emotion reacts to the price, and human reaction of greed and fear does not change. 

3.jpg

I have spent months and months looking at footprint charts to see if it could give me a edge in scalping, and I didn't find any. Took some time to realise that price by itself is good. 

4.jpg

This one is gold according to me, I think this is something I share with all developing traders that work with me.

With the excerpts covered here are my thoughts on the book.

  • This is a first of its kind, in terms of a book which uses NIFTY 10 year historical data to analyze price patterns.
  • Very objective and measured in its approach. 
  • A good primer to understand NIFTY
  • A good start to get ideas about testing NIFTY data and creating your own trading set ups.
  • A must read for anyone trading NIFTY on any time frame.

Here is the Amazon link for you, i.e if you want to buy the book. High Profit Trading Patterns Paperback – by Kora Reddy

Request - For heavens sake don't photocopy this book or buy a pirated version. That's the best way to dis-incentivize more people from writing a book. 

Article Excerpt & NiftyScalper Data Analysis - Fundamentals of Short-Term Trading : Part Two | Dr. Brett N. Steenbarger

Ever since I began my journey in the world of trading, articles and books by Dr. Steenbarger has been of great value to me.

Coincidentally I came across this excerpt where he is alluding to the idea of looking at markets horizontally, something that one of my team members' tried analyzing sometime back. First things first, here is what Dr. Steenbarger has to say.  

Article link - http://www.brettsteenbarger.com/Short-Term%20Trading2.doc

All the seasoned day traders that I have interacted with, either intuitively or through analysis, have said the same the thing, ie Not all time slots are the same.

Lets look at the volatility spikes on an Intraday basis for NIFTY. This was 2 years data, and we tried to do the same horizontal analysis by normalizing each day's move. You would clearly see two peaks and a trough. Of course this does not give a nuanced picture as a Monte Carlo analysis would, but still tells us quite clearly where the "meat" is. 

On a closing note, I was once told by a developing trader that he take trades only after 10:15 am IST in NIFTY, as he "believes" that's when you get an opening range breakout. Needless to say, he would get stopped out more often than not, and perhaps would see his trade move in the intended direction, couple of hours later. 

A simple horizontal analysis can help you time and size your trades optimally. Try it out.

Book Excerpt - Layered Position Sizing

While a lot of popular texts in position sizing and trade management say, don't ever add to a loosing position, I realize that like everything else in life, there is some more nuance and context to it.As I delve deeper, read and listen to more professionals, I am getting contradictory views on that.

There seems to be some merit in scaling-in (averaging down) and scaling-out of positions. I am reading this (http://www.amazon.in/Prop-Traders-Chronicles-Short-Term-Proprietary/dp/1118241088) book currently and found this interesting excerpt.

Meditations on Screen-time - Part 2

In the first part, over here - Meditations on Screen-time - Part 1 we talked about what is it that one needs to do while looking at charts, the first aspect that we focused on was the difference between Seeing and Observing. 

In this post we will move further and see what is it that we can do with what we have observed.

By observation we collect data or information about whatever we are observing, we may be looking at a 1 min time frame chart or a 5 min time frame chart, or perhaps a footprint chart, it could be anything that is contextually relevant to you. Over time with note taking and reflection, you would have a lot of this information in your mind, what the psychologists call "Crystallized Intelligence". 

The next step is to put this observed information to use, by making inferences (Fluid Intelligence). There are two ways to look at the concept of "Inference" one is - as a plausible explanation about an observation (The Why), the other way to look at inference is the way Bayesians use it, for them Inference-ing is about thinking in terms of probability distributions, and updating the values we assign to the distribution as we come across new evidence. If that is too much to handle, let me try to simplify it with an example.

Let's say you have been observing the breakout in NIFTY the moment it crosses Day High, there are few ways to cognitively process this information -

a) You can think of "causes", meaning why is the price shooting at the point. You may deduce that perhaps stops are getting triggered etc. - This is an example of the first type of inference. No harm in doing this, the only limitation is, a lot of times its more difficult to find causes than correlations, and as a trader you know whats more important.

b) You can think in terms of "averages" - You may deduce that usually it shoots up by 10 points and keep that as a reference. This is good but then "averages" are not that precise as we know, and more importantly does for help build a framework/scaffold on which one could build a sort of model as more data/evidence is observed. That brings us to the third way.

c) You can think in terms of "Probability Distributions" and "Conditional Probabilities" - Every time you observe the breakout you could create an imaginary distribution.

For instance keep one can keep the following exponential distribution in mind (look at it more from a visual perspective rather than for it's mathematical accuracy)   

Now imagine, putting all your observations on the curve, perhaps adjusting the curve based on observations. That would get you to think about the outcomes more from precisely. You may be able to tell yourself, if Day High crosses we will get 2 points for sure, I am 90 % confident about it. 

Now add to this some "Conditional Probabilities" - Lets say you also observe that on days were you get a range beyond X in the first half of the day the above distribution no longer remains valid.  Now what you have done is you have found an exception to the above rule. Over time you would be able to "cognitively" add several such conditional exceptions as well to your inference. 

I hope the above example helps you visualize outcomes in a more structured way. If you are more interested in the Bayesian way of thinking about situations and outcomes you may want to start here. 

https://www.farnamstreetblog.com/2012/12/thomas-bayes-and-bayess-theorem/

So at the end of it, all the time you spend in front of the screen, watching price action and charts should help you create a probabilistic framework in your mind, and the more you gather evidence the more you should be able to refine your "confidence levels" of the outcomes.

As always happy to hear more form you. 

Meditations on Screen-time - Part 1

Recently, I gave an assignment to a novice trader to observe certain parameters and trade locations, on live NIFTY charts, as the market develops. So, at the end of the week, we had a catch up session to exchange notes. I was eager to know what he had observed. 

I asked the question "So what did you observe in the past 5 days every time when NIFTY crosses the VWAP?" - He said, "NIFTY either goes above VWAP or below it, and that keeps happening, I don't know what else you wanted me to watch, (he also added) I actually watched it for a couple of days and then stopped, as it didn't make much sense to me"

I was not really surprised, as this was not the first time such a thing was happening. So over the long weekend I thought of reflecting on what is it that I really expect them to do while watching the charts, so here is a two part series on Screen-time, in the first part we will focus on the idea of "Observation" and the next would focus on "Making Inferences"

When I started trading, I actually didn't know what "Observing" was all about, I used to see the charts. It was only a year into trading, and much reflection later that I realized what I was doing. So first things first.

Seeing vs. Observing 

Read this instance from Sherlock Homes's "Scandal in Bohemia"

http://bigthink.com/artful-choice/dont-just-see-observe-what-sherlock-holmes-can-teach-us-about-mindful-decisions

In the context of trading, here is how I would translate what Sherlock is trying to say.

Observation includes the following

1) Capturing Statistical Data - When observing, are you looking at data elements like, time taken for the price to move from point A to B. A being a reference point, how many times does the price B get revisited, and things like this. While you are doing this the next point should also happen in the background.

2) Creating a Mental Baseline - After observing the charts for a few days, across the same reference points, you should be able to create mental baseline, for instance, If the price moves beyond this point, it does go up by X points on an average. This baseline would get refined over time, but this "program" has to be running in the background of you mind all the time.

Now that we hopefully have some idea of what does it mean to "Observe" lets looks at some ways to enhance the process of observation.

How to get better at Observing?

1. Focus - Imagine you had two tasks to choose from - a) To look at every passing vehicle on the road to see if it,s registration number starts with odd or even b) To look at every passing two wheeler and see if its registration number starts with odd or even?. In all probability your performance on the task (b) would be better. Same logic here. If you look at too many things, too many indexes or stocks, its difficult to observe something specific. The other side of focus is also distractions - It could be in the form of other people in the immediate environment, browsing something else, phone calls etc. That too needs to be controlled.

2. Perspective - Taking the same example as above imagine you are given two more choices now -  a) To look at every passing two wheeler and see if its registration number starts with odd or even?. b) Sit in a control room and look for all the passing two wheelers, both from back and front - again in all probability your performance on the task (b) would be better. This is akin to watching both the CE and PE option strikes of an instrument. You can also build perspective by looking at the same instrument in different time frames, same instrument with different types of charts, for instance you can juxtapose both a foot-print chart a candlestick chart. Or may be a PnF chart and a Candlestick chart. The idea is to get multiple perspectives of the same instrument.

3. Technology -  Well, here technology means, more screen real-estate. One of the reason a multi monitor set-up helps is it, helps you simultaneously view the price action,  which is very different from flipping across tabs. It does not (at least to me) give the same visual perspective. Take at look at my set up below.

On the top are footprint charts of NIFTY and BANKNIFTY along with PnF charts + The bottom two monitors are dedicated to slightly ITM CE and PE

In a way on a single side/pane (without having to turn my head) I get to see multiple views/perspectives of the same instrument. Personally I would say, this has been one of the best investments that I have made in my trading business, and it has enhanced my understanding of NIFTY quite a lot.

4. Documentation - Note Taking, also plays a very vital role, I have seldom seen a high performing trader without a note book on his/her trading desk. How to make notes perhaps could be a post by itself. But at the moment we will keep it simple - so do jot down, things you may want to refer, back test, or explore further later. Essentially what note taking does is, it eases the job of your memory for more important tasks and there by improving your cognitive capacity. 

All the above steps should help you increase your ability to capture "cognitively"
speaking much more than what you otherwise would.

In the next part we will explore, what is it that we can do with this observation. The logical next step would be to "Make Inferences".

Also you may want to look at this old post on visual perception, which obviously is related to Screen time. - Learning to see data - NYT Article Summary & More

What Can We Learn From Expert Gamblers? - Dylan Evans

This is an awesome talk which touches upon the ideas of Risk Management, Probability and to some extent the "Mindset" needed to manage risk. Watch it and let me know what you think.

The map is not the territory - Part 2 of 2

Last week in part 1 of this post, I linked a video by Julia Galef, where she use the metaphor of a Soldier and Scout to refer to two different mindsets. 

In the trading/scalping world. These two metaphors could be used to highlight two key skills needed to scalp. Let's see what they are.

Scalper as a Scout - If you remember in the video, Ms. Galef says, "The scout's jobs is not to attack or defend, his/her job is to identify the terrain, look for any obstacles, and above all understand whats out there as accurately as possible" 

In the scalping world it means, knowing the "Range" probabilities of the instrument that you are trading. You need to know how far can it go in either direction. The following are some of the questions that you would need answers for.

  1. What is the median/mean range of the instrument that you are trading?
  2. What is the standard deviation? or IQR interquartile range?
  3. What is the probability of a mean reversion of the instrument on an intraday basis?
  4. Are there any time based probabilities? For example is there a a time slot where the probability of a mean reversion is higher?
  5. If range expansion happens, at what time slots is there a higher probability of an expansion? or does it expand in a linear way? 
  6. Are there any day based probabilities? For example are Mondays on an average low range day or expiry days are high range?

As as scalper you need to know all these and more, that's the terrain on which you would be fighting the battle. How can you even afford not to know it? Remember how the Allies (with all their artillery and trained soldiers) lost the Battle of Gallipoli against the Ottaman empire. One of the main reasons for that was inaccurate maps and lack of understanding of the terrain. 

Back to markets, so without understanding the range probabilities of the instrument, your trading tools (read charts, indicators etc.) are all of no use. You cannot be shooting bullets if you are down in the ditch. 

Scalper as a Soldier - While you definitely need to know the terrain well, you also need to know how to fight the battle. Which in the language of trading would mean, entries, exits, scaling-in and scaling-out, understanding indicators and other tools for precise entries and exits.

You also need, psychological traits of courage, patience, and most importantly resilience.  

Lastly, it's important to recognize that as Soldiers sometimes we loose sense of the territory, after all maps are not territories. They are abstraction of the territory. Maps are in our minds.

In the words of the Polish American philosopher Alfred Korzybski these are metaphors of belief and reality - "Reality exists outside our mind but we can construct models of this 'territory' based on what we glimpse through our senses." - Perhaps that's the reason we use the term "Mental Maps" and not "Mental Territories".

The only way out of this Map vs. Territory paradox, is to reconcile both, as often as possible.  


The map is not the territory - Part 1 of 2

A few days back, I was having a coaching conversation with developing trader and as usual I started with the concepts related to Range (High-Low Range of NIFTY). Being a young, eager student, he said - "No No, I know what a range is, and all that, all that I need to know is when to Enter and when to Exit, that's more important for me" 

And, unfortunately he is not the only one I came across who was more interested in Entries and Exits than in understanding the boundaries of the playground i.e before playing the game.

I follow Julia Galef through her Rationally Speaking podcast, and she has done a very relevant Ted Talk about decision making. She uses the metaphor of the Soldier vs. Scout to illustrate two different ways of Information gathering and there by using that information for decision making. 

While I do recommend that you watch the video for yourself, here is a summary of what she is saying.

There are two ways of looking at the world around us and gathering information. In our context let's say you are looking at the index/markets.

Soldier Mindset - This is a metaphor for people who engage in what is called Motivated Reasoning, meaning - Unconscious emotional drives impacting our decisions instead of reason and facts. People who use this approach consider some ideas as allies and want to hold on to those ideas and other ideas as enemies,and would we want to shoot them down.

Let's say, you follow someone on Twitter and that person says, I think this is the bottom for the day, now you really admire this person (for several reasons), now there are two things possible - He/she is right or He/she is wrong. No issues at all if he/she is right as you know and believe that they are pretty good at predicting the markets. However the problem is, when they are wrong - you would find it very difficult to convince yourself that they may not be that great at predicting. Instead, you may want to give them some benefit, and continue to hold them in high esteem, because that belief in this person is of greater value to you than being curious to check or re-examine your beliefs.

You can also be applying the "Soldier Mindset" to your own self. Let's say you believe in some "Gann numbers" thing. If it works even a little bit, your belief in that system only grows stronger. Now lets say it doesn't work. What you would do is, instead of questioning the rationale behind the system, you may just brush that instance aside or even put your own reading in question - Telling yourself - "Oh may be I don't know Gann system so well. I need to work more on it."

I am sure you get the drift now. It's essentially about holding (unconscious) biases while gathering information and making decisions. 

The other side is what she calls the

Scout Mindset - Here the person in question is driven not to make one idea win or other loose, but to see what is there. This person is looking for facts and evidence. He/she is curious and takes pleasure in learning new information, even if it contradicts his/her own belief. In fact, some people with the "Scout Mindset" may seek others who are willing to contradict their ideas. They constantly keep testing their own beliefs. More importantly they are grounded in the sense, their self worth is not tied to them being right or wrong, but instead to finding what is right or wrong.

She also points to the fact that people with "Scout Mindset" make better quality decisions and this mindset does not correlate with IQ. So you could be very intelligent but bad at decision making.  

So whats in it for us Scalpers and Traders?

As traders we make multiple decisions and use varied frameworks to understand market structure. Obviously our success depends on making more of right decisions and less of wrong decisions. And if you are developing trader its important that you start with creating and following frameworks which are more evidence based rather than "belief" based. In other words you need to be more of a "Scout" rather than a "Soldier".

So what is it that you could do to develop a "Scout Mindset" as a trader?

  1. Ask for evidence - Whenever you come across a system or an indicator, always seek evidence in terms of back tests, better still learn to do these yourself. Perhaps learn to code in Python or R.
  2. Develop co-relational curiosity - Looks for co-relations between different signals/events. If X happens does Y also happen.
  3. Calculate Probabilities - i.e - Yes if X happens Y also happens, but how often does Y happen? - This would tell you if there is an edge in the co-relational relationship that you found. 
  4. Question Ideas, People and Systems - That's the only way to progress. If you find someone becoming uncomfortable with your questions and becoming defensive, that's a sure sign of a scam. 

Unfortunately this is an industry full of snake oil sellers who feed on thousands if not millions of bright eyed suckers who come in everyday, only to loose their hard earned money and more importantly their self-worth.  Being a "Scout" is one good way to avoid this eventuality. 

I am sure by now you may thinking - All this is fine, but what was that Range, Map and Territory thing? - Well that's for Part 2 of 2 


Getting Started - Scalping Basics - 03

So here is the review of Part 3 of the Six part series. This one is titled "Trade Execution" 

Part 3 of 6 - Trade Execution

Previous parts here - Part 1 of 6 - "Define, Expect & Explain"; Part 2 of 6 - "Searching for Opportunities"

Though execution is an important topic, a lot of what is shared in the video is not relevant from from an Indian perspective. I would still urge you to watch the video. Below are the key ideas shared in the video from an Indian perspective.

Scalping Efficiency - Here Tom talks about understand the products that you would like to scalp and then goes on to explain which are the better suited products in the US market. Let's look at products in India , given the way taxes are structured, Options are any day more cost efficient products in India.

Let's compare the costs - 1 lot of NIFTY Futures vs. 1 lot of slightly ITM Call Premium (Delta 0.7 approx) 

Compare the STT which is almost 12 times more for Futures. The net loss of trading for a 1 lot is 6 times higher in Futures. Also note the break even points. almost 2 times more. I would suggest you do the math yourself using the Zerodha Brokerage Calculator

Orders - Though Tom talks about "Marketable Limit Orders" more about it here, we in India don't have that choice. Its either a Market Order or a Limit Order. Yes, there are other orders like Cover Order and Bracket order that is available, but they don't work for my trading style. Since every penny matters in Scalping, it only makes sense to do limit orders and if required manage the position by scaling-in.  But both entries and exits have to be on Limit orders unless in an exceptional situation you just want to square off and scoot.

Default Size - Tom says 1 lot has been a default size for him, but then he is talking about futures in the US. I would answer this in a more nuanced way. (Disclaimer - This is the method that I use, there is no best way to do it, there are several ways, just that the below described method works better for me, happy to hear your comments) 

I trade in a way, where I identify a trade location. Once price gets to my trade location, I define boundaries of that location, and scale-in to my position in tranches of increasing sizes, for example if 10 is the total number of lots allocated for the trade in a specific price zone of 10 points, I would scale in with a the fall of every 3 or 4 points with 2,3, and 5 lots. This approach works (only) if used in a context of a larger probabilistic framework. Similarly, I also scale out of the trade and trail around 30% of the position to catch larger moves.  

So the bottom line in terms of size is, define the size that you would like to trade, and don't change it arbitrarily, also define a stop loss level based on the average cost of the position. More on this when we talk about Risk Reward ratios.

Market Depth  - Most of us i.e retail traders have access to Level 1 Market Depth, which shows us 5 best ask and bid prices, I personally do not see an edge in that, however, glancing at it would give us a sense of the bid-ask spread, volatility/rate of change, and the volumes being traded. 

Order flow - To view this, you would need a tick data feed, preferably e-signal and some charting tool like Market Delta for foot print charts. This data again has limited predictive capabilities, but definitely better than the minimalist market depth. Here we can, to some extent, identify large lot buyers, spot cumulative volume delta divergences etc. I subscribe to these through Vtrender.

All these tools help us make a probabilistic guess about the very near term market direction (30 minutes to 2 hours), and add to that a cost efficient product helps us make the best of the market moves.  

Hope you found this useful.

Feel free to post your questions or write to me on srao@niftyscalper.com

Trading as a way of life : Jihan Bowes

This guy is awesome. Sums up trading pretty well. Do give it a dekko and don't miss the hip hop part at the end.

How to analyze markets on an Intraday basis? - Damon Pavlatos

I have been following Damon for quite some time now, he is a market veteran and has been in the broking business for decades now, he also happens to be married to another favorite trader of mine Linda Bradford Rashke.

In this short video he gives us a glimpse of how he looks at the market on an intraday level and that should tell us, the novices, what to do.


Quora Question - What is the best technical course in trading for developing myself as a professional trader?

https://www.quora.com/What-is-the-best-technical-course-in-trading-for-developing-myself-as-a-professional-trader/answer/Sandeep-Rao-7

What is the best technical course in trading for developing myself as a professional trader?

I wish there was a simple answer to this question like - These are the top 5 trading universities in the world, write the TMAT exam and apply for each of them.

Ok. Let’s get real.

The fact is there is no such university. You would need to design your career/education and life.

The following are some recommendation that I would have if you are looking at becoming a professional trader

    1. Your best bet in this case would be to pursue - Chartered Market Technician Program this program. Its a self study program and you would need to clear a qualifying exam to be certified. Pretty well recognized in the industry. - Please note this is not at all a necessity. Nor is it sufficient by itself. Its a nice to have certification.
    2. There are no other professionally run courses that I would recommend. Always go with a “Caveat emptor” mindset when looking for a commercially run program.
    3. Zerodha has done an awesome job of creating content for an Indian context - Zerodha Varsity - This could be a good starting point.
    4. Look for mentors on Twitter, Trading forums, Seminars, Conferences - identify who are the people who contribute better, connect and seek inputs. Again, not easy, but this is what works in the longer run. And yes please beware of snake oil sellers, there are thousands of them. And the best actually never sell, because they don’t have to, they trade for a living.
    5. Create a learning plan and ecosystem for yourself - Listen to videos, podcasts - make notes, structure your learning, that would help you connect the dots.
    6. In this whole process you will learn a lot about trading and also about your own personality and what kind of trading works for you. From this phase onward you would become more nuanced in what you want to learn. That would be the starting point on your way to become a professional.

Finally want to leave this post with a task for you - Listen to a dozen interviews of traders on - Chat With Traders Podcast | Hosted by Aaron Fifield - Usually Aaron starts with the question - How did you get into Trading?

Standing on the shoulder of giants

Long weekend and I was reflecting on all the people who have helped me on my journey to become a better trader, these are the people who've in many ways influenced my thoughts, some of them have taken time out to help me understand certain nuances. You know who you are. My heartfelt gratitude to all. 

Listing in no particular order, but categorized based on medium

Youtube Channels

1. Chat with traders  - Aaron does a fantastic job of interviewing people. There are some podcasts that I have gone back to several time. I will create a separate list of must listens later.

2. SBM Capital - Mike Bellafiore and his team at SBM do an awesome job of sharing knowledge again a someone I look up to and a channel that I follow. Really no nonsense stuff.

3. Futures.io - This is another channel with very relevant webinars.

4. Wikimaniacs - Fairly good assortment of content, they have all the popular and big names covered.

 Forums

1. Trader Laboratory - This one is absolute gold. Esp. follow content by jperl and soultrader. I owe these guys a lot. 

2. Forex Factory - Follow posts by dee50

3. Capital Mind - This is a paid one, but have learnt a lot from various people and the discussions, esp. vyr

4. Twitter - I will put this in the category of forums - the below list of people are worth following

  1. @Thakker_Inv

    Network Engineer by profession. Market Profile learner and trader.

  2. jay

    @niftywizard

    Entrepreneur & Independent Nifty Future trader. Market profile,Volume,ADX. Tweets are commentary only, you must analyze & trade at your own risk!

  3. Lance Beggs

    @LanceBeggs

    Futures Trader & Trading Educator

  4. Varun

    @sweetspottrader

    l Am The Smart Money U Guys Talk About . Travel ,Food ,Fitness ,Yoga,Stock markets and Harvey Specter

  5. 30m & OF

    @VerdiTrader

    Tweets are only for learning purposes, I don't recommend anyone to follow me or my tweets and act based on them since I make mistakes all the time.

  6. Last Hour Trader

    @IMRiskManager

    Avid Reader, Keen Observer, Curious Learner, Skeptically Optimistic. On Twitter for learning and sharing knowledge. 

  7. RK

    @assortZ

    Life revolves around Nifty,BNF,Basket of 15 stocks,Market Profile and Ilaiyaraja

  8. QuanTrader

    @StoicTrader

    "Pure mathematics is, in its way, the poetry of logical ideas." - Albert Einstein

  9. Shai

    @Am_Shai

    Index Trader on NSE trading with MarketProfile + OrderFlow. Reach me - vtrender@gmail.com

  10. AP

    @ap_pune

    Chem engineer in international oil & gas industry; Technical analysis of stock mkts / Sports; Tweets on mkt purely meant for educational purpose

  11. Rishi Umrania

    @ProAMTraider

    #AMT #MP #VSA #OFA Hybrid Trader = Discretionary system - Systematic discretion. Founder @justfintech & Gaffer in Film Industry. 

  12. Sunchartist

    @Sunchartist

    Macro / Technical analysis a labour of love , travel, foodie, current affairs

  13. Brett Steenbarger

    @steenbab

    Trading coach, psychologist, author, blogger, and stock index trader

  14. Raghunath

    @RaghunathHyd

    Markets, NSE, Futures and Options. Ideas & Strategies in FnO. Anything posted on the timeline should not be taken as an advice but for only…

  15. Prashanth

    @Prashanth_Krish

    Chartered Market Technician, Stock Market Trader, Systematic Trend Following, History & Movie Buff.

Websites & Blogs

1. TastyTrade - I think I have spoken enough about this in the past. 

2. Trading Naked - Nice site for basics of Market Profile

3. http://www.smbtraining.com/ - Again search within the blog and the site, this is another treasure trove.

4. http://traderfeed.blogspot.in/ - How can we not include Brett's blog. This is my go to place for anything to do with trading psychology, also sometimes find interesting information about market probabilities and statistics.

That's pretty much for now, I will keep updating this list as I go along. Hope this helps you get started.

Mastery Series - Neurobiology of Practice & More

This is first one in the series on Mastery 

Pick up any text about Mastery and you are sure to stumble on ideas of Deliberate Practice, Reflective Practice and the famous 10000 hour rule by Anders Ericsson.

This short Ted-Ed video is a good watch as a segue in to the topic.

Here is what it talks about

  1. What does practice do to our brains - The neurobiology of Practice 
  2. How many hours of practice do we need for Mastery?
  3. What kind of practice matters?
  4. What constitutes quality practice?
  5. Beyond practicing is there anything else that one can do?

Watch this video to get the answers to these questions. At the end, Trading or Scalping after all is a skill and like any other skill needs sustained efforts and intense practice over long periods of time.

So off I go. Time for some reflective practice.


Getting Started - Scalping Basics - 02

So here is the review of Part 2 of the Six part series. This one is titled "Searching for Opportunities" - It's a rather short one.

Part 2 of 6 - Searching for Opportunities 

"Liquidity is the most important prerequisite" - This is something that we discussed in the previous post as well, and to tell you something interesting, NIFTY Options is the most liquid product in the world. Take a look at this NSE press release. Yes there are some nuances to it. Like, when it comes to scalping NIFTY, you would find that ATM and slightly OTM strikes have better volumes compared to ITM strikes. Also strikes ending in 100's have higher liquidity than those in 50's. But at the end, when it comes to liquidity nothing comes close to NIFTY options.

"The very act of scalping is initiated by the market itself" - "Price extremes are a good place for market forces to push price in the opposite direction." This is what Tom Sosnoff says. In other words I guess he is trying to say that markets are mean reverting, and that is where the opportunity lies. It's very true for NIFTY as well. At NIftyScalper we use probabilities of mean reversion to trade, and you would be surprised to know that there are specific time slots with certain mean reversion probabilities. I practically make a living of it. 

"Ranges are the key to scalping" - You need some range, some movement to scalp. If you look at NIFTY Index data you would get a sense of the average range of NIFTY. It comes to around 80 points i.e the High-Low range, which is what we are interested in, not the Open-Close range.

If you are scalping options, the delta of the strikes would play a role here. I usually scalp ATM strikes, so you would have a a delta of (0.5) which means a range that is half that of the Index. There are a few days in a year where the index itself is in a narrow range of sub 50 at times, that is when it becomes difficult to scalp, but then ranges are also mean reverting, there are periods of expansions and contractions.


Role of VIX or the Volatility Index - This is something they allude to indirectly by referring to expected move in the index. More on what it is here.

It's important to understand the implications of VIX and its correlation with NIFTY. It helps us build on our market awareness and also aids in having a directional bias while scalping.

That's pretty much for this episode. The next one is about "Trade Execution", I would say its a key building block of scalping. Eager to write about it as there are a lot of contextual differences which need explaining.