When we talk of ‘edge’ in trading it essentially means, what is it different that you or your system has which would lead to an ‘alpha’ in terms of returns. One way to extend that question is to ask ourselves, as to what are the sources of that edge?
To me having a more deeper and nuanced understanding of the contexts and setups that I trade, exponentially adds to my edge. To get a better sense of my contexts, one of the practices that has massively helped me in my trading, is curating setup specific data. This is a lot of work, let me tell you. Sometimes it’s very difficult to train the computer to do what we humans can do intuitively, which means a lot of it is manual labor.
Let me try to give you a sense of what I mean, if you follow my blog you would know that, these are the three setups that I trade.
NIFTY - Scalping Set-up - 01 - Opening Spikes & Opening Drive
NIFTY - Scalping Set-up - 02 - Mid-Day Mean Reversion
NIFTY - Scalping Set-up - 03 - Afternoon Range Extension
Now each of these setups have their nuances and details, like
a) At what time did the entry get signaled? Is that time range bound? Is there a seasonal skew to it?
b) Range breakouts on VIX? Time and Amplitude.
c) What is the average size of the pullbacks that in the setups you trade?
d) What is the ideal holding time for your some of your setups, based on the length of the trends?
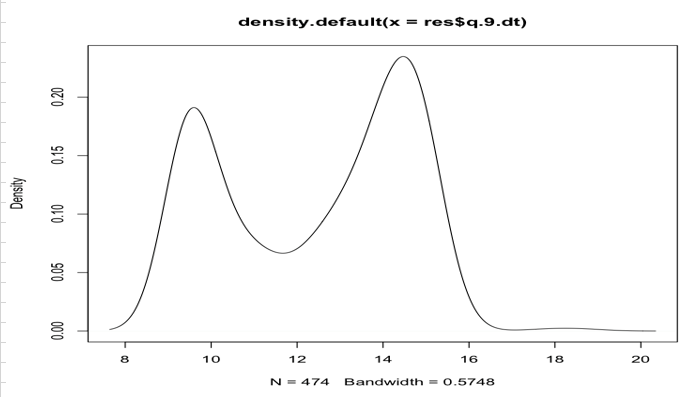
A lot of these computations are possible only if you have specific data. Therefore, this is a practice that we follow in-house and for our clients - i.e. to capture such data so as to run tests on it.
Here is a mini snapshot of the data. (Disclaimer : The snapshot may make no sense whatsoever without context)
This practice when followed over long periods of time can give you a gold mine of data, which (I believe) can add to your trading expectancy.