

Ever since I began my journey in the world of trading, articles and books by Dr. Steenbarger has been of great value to me.
Coincidentally I came across this excerpt where he is alluding to the idea of looking at markets horizontally, something that one of my team members' tried analyzing sometime back. First things first, here is what Dr. Steenbarger has to say.
Article link - http://www.brettsteenbarger.com/Short-Term%20Trading2.doc
All the seasoned day traders that I have interacted with, either intuitively or through analysis, have said the same the thing, ie Not all time slots are the same.
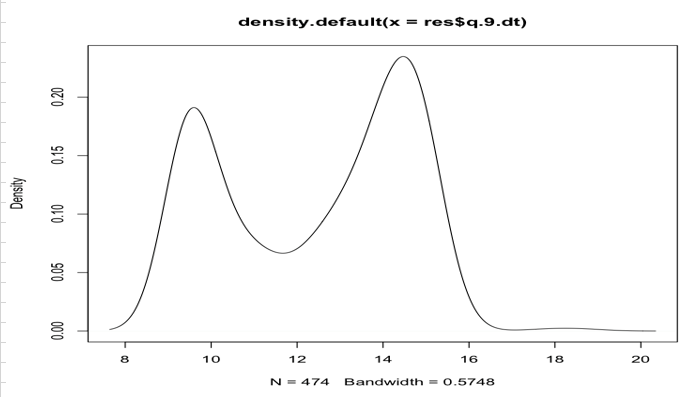
Lets look at the volatility spikes on an Intraday basis for NIFTY. This was 2 years data, and we tried to do the same horizontal analysis by normalizing each day's move. You would clearly see two peaks and a trough. Of course this does not give a nuanced picture as a Monte Carlo analysis would, but still tells us quite clearly where the "meat" is.
On a closing note, I was once told by a developing trader that he take trades only after 10:15 am IST in NIFTY, as he "believes" that's when you get an opening range breakout. Needless to say, he would get stopped out more often than not, and perhaps would see his trade move in the intended direction, couple of hours later.
A simple horizontal analysis can help you time and size your trades optimally. Try it out.