One of the turning points in my trading journey was the time when I stopped predicting direction. It doesn't come easily and naturally. Needs a bit of conditioning but once you get through it, your cognitive algorithm works like a charm. It moves from a binary to a bayesian mode.
Let me illustrate the two ways of thinking and how it manifests in the words that we use.
Trader 1 - Oh it has moved beyond this level now its not going to come down, its going to continue in that direction itself.
Trader 2 - The price may go up or down, if it goes up it should go till this point, and if it goes down it should go up till this point.
Notice the difference in thinking. Trader one is thinking in more or less a Binary way, there is no nuance there. Trader 2 is bayesian according to me. Because there are multiple outcomes each specified with a different confidence level.
Let see how this can be applied to scalping
Look at Figure 1 below. This is a 1 minute TF chart with the Green Line being the VWAP. Look at the last few candles, where do you think the price is headed? Obviously looks as if its going down.
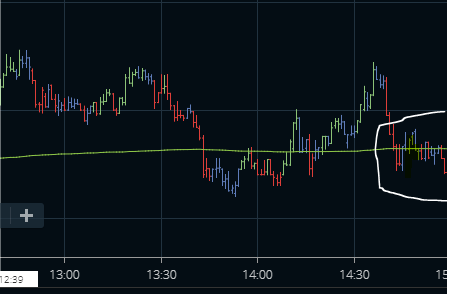
Figure 1
This is a 1 minute TF chart with the Green Line being the VWAP. Look at the last few candles, where do you think the price is headed? Obviously looks as if its going down. Now look at Figure 2 below.
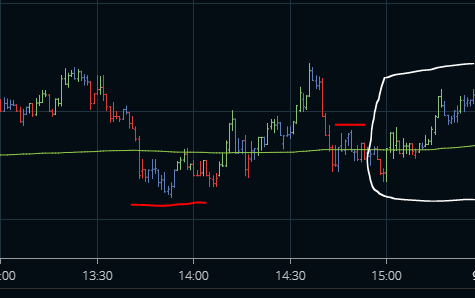
Figure 2
Such shifts are part of everyday price action, the only way to deal with them is to define "Trade Validation/Invalidation Levels"
That brings us to the topic of Momentum. Momentum has two parts to it a) Direction b) Speed. When scalping you cannot predict direction. What you can do is to take a probabilistic call on two things 1) Possible extent of move from a given reference point. ( This needs to be arrived at based on back-testing) 2) Volatility - Which is similar as 'speed' of the move. (Which again can be arrived at by back-testing for time intervals with high volatility)
In this case VWAP would be your reference level, the points marked in red (Figure 2) would be points of validation or invalidation depending on the direction that you are trading. Based on which you would also have to create a Risk Reward ratio to trade in such locations.
So the idea of this post was to explain why its futile to predict direction, instead its better to go with the probabilities and bank on volatility to get you to your targets.
Also remember there are times when price would get to the point of validation and invalidation and still may reverse from there, what do you do then, I will leave it for another day.
Happy Trading!