Blog

Market Profile, Order-flow, Footprint - Demystified - Part 2

In the previous part - here - https://www.niftyscalper.com/blogs/2017/12/7/market-profile-order-flow-footprint-demystified - We got an overview of what these concepts are and how they fit in together.

Now in the part 2 - I am going put together my views on the relevance of these tools, in the context of Intraday trading and Scalping.

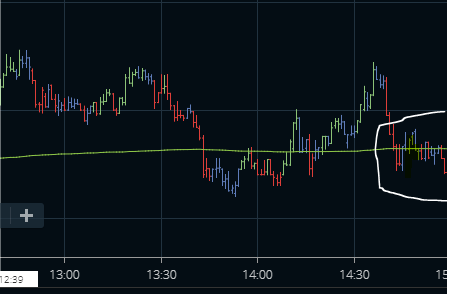
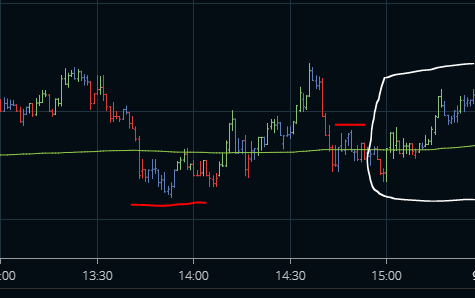
Does following the market profile concepts like POC, VPOC, IB, VAH, VAL give you an edge in your trading?

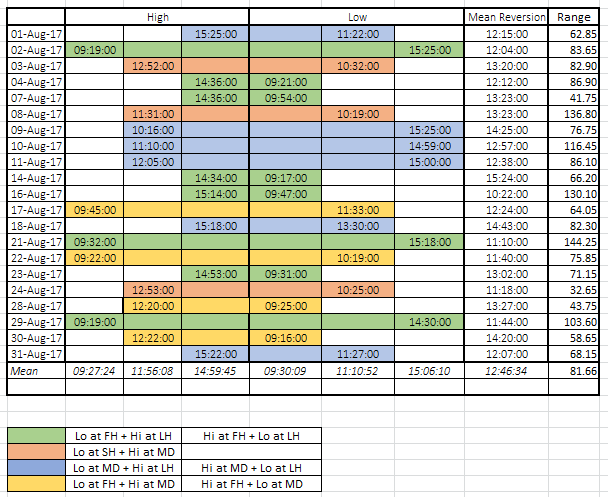
In all fairness, I must say conceptually these make sense, but are of no value in the context of trading decisions if you do not have back-tested probabilities to work with. In other words these things make for good reference values, but that does not help in trading. What you need is probabilities off the references. For example you need to know - % of time POC acts as a support, or once the price crosses IB, you get an extension of y points more than 70% of times. So bottom line, no back-tested probabilities, no use of these concepts.

Does following the ORDER FLOW / FOOTPRINT give you an edge in your trading?

This is a difficult question to answer, it has several parts to it

a) Quality of Data Feed - Like all other things in data analysis, garbage in is garbage out - Though you may have the best of the charting software, if the data feed sends garbage to it, its not going to be of any value. That is one reason, if you compare two foot print charts with data feeds from two different vendors, you should not be surprised to see different data in both the charts. Then there is a larger issue of the quality and nature of the data that the exchange shares with these data feed providers, this is where protocols like ITCH and OUCH come into picture, without which your order-flow becomes less reliable. I seriously doubt if NSE provides such granular data. Read the excerpt below from the book  - Machine Trading: Deploying Computer Algorithms to Conquer the Markets - by Ernest P. Chan

b) Back-testing Order-flow Data - Again, you need some references to work with even if you have Orderflow, for instance any buyer of greater than x size leads the trend by y %. This back-testing, is not easy at all given the quality of data that we have. As shared in the excerpt above.

c) Smart money & Orderflow - This one really gets my goat. Let me give you a few examples of what some "experts" claim.

Now let me share something from the horses mouth, ie the makers of these charts. - https://www.sierrachart.com/SupportBoard.php?ThreadID=2119 - Read the text again. 

This is like the drivers who claim that their cars can fly, but the manufacturer of the car says you cant. Who do you trust? - I leave it up to you. 

However, I do think there is evidence for the use of Cumulative Delta Divergence, but again not without back-testing it. 

So to sum it up, I believe if you have backtested price data, that in anyway subsumes volume, if you want you could do correlated backtests along with volume data, even better, but you don't need anything more.

At the end of the day, you also need to understand that we humans cannot process so much of information that multitude of charts and indicators offer, we need to in a way simplify our decision making, by focusing on probabilistic models/frameworks fewer markets and instruments.

With that I rest my case on this. 


Market Profile, Order-flow, Footprint - Demystified - Part 1

It's been close to a month since I started my trading room, and the response has not been bad I must say, close to 116 members and counting. To me more than the numbers what matters is the collective wisdom which is both created and transferred among members, more so because trading esp. the way retail traders operate, is a very lonely business and one has to find like minded people to work with. So on these fronts, I am pretty happy with the way things are progressing. Oops, I think I went on a tangent.

Coming to the topic, incidentally two members in the room asked me

a) Why I don't use Footprint charts? Wouldn't it give us better entries and exits? 

b) Why I don't you use Market Profile? Isn't it better to look at the markets from that perspective?

Two more members didn't ask me, but told me something

a) I was in a room where they claimed to use Market Profile/Orderflow and Footprint charts, but I lost 30% of my capital by following their trades, I hope your system is better.

b) I was a in room where they claimed they tracked "Smart Money" - But I didn't see any value in it in terms of their win rates.

That made me realize people really need to be educated about what this whole thing is. All these things are becoming some sort of "Snake Oil" to be honest.

Lets start with what is Market Profile.

There was this guy by the named Peter J. Steidmayer who was a trader at CBOT, and later had a management position as well at the exchange. He developed this approach to view the markets, in the form of a normal distribution. As you can see below, the middle area is the area where 70% of trade happened. 


Next he developed a way of representing Time, Price and Value - "Value" here means the price region where more than 70% of trades happened.  

Then there are concepts like POC - Point of control, POC represents, as you can see above, the the price at which trading happened for the max duration of time. VPOC is slightly different but related concept from Volume Profile, its the price at which max volume was traded for a given time frame. We will refer to Volume Profile at the end.

He also defined certain day types based on how prices get distributed on a given day. 

http://www.marketcalls.in/market-profile/market-profile-different-types-of-profile-days.html

The link does a good job of explaining, the concept of day types. At a very basic level what it means is if the day was Trending, Range Bound etc. with reference to something called IB - Initial Balance which is defined as the range of the first 30 mins or 1 hour.

So if the price keep holding above IB it obviously means buyers are in control and visa versa if price keeps below IB. I like these concepts, IB, Open Drive types etc. But they need to be tested for specific markets. So from a perspective of looking at the markets its good to use some of these concepts.

Now coming to the other two things Orderflow and Footprint

Orderflow - The interaction between the buy orders and sell orders and the price discovery at a given moment - Which happens with the combination of limit and market orders.

http://optimusfutures.com/tradeblog/archives/order-flow-fundamentals/

Read the above link irrespective of whether you are interested in the blog post or not, its very important for any trader to understand how and why price moves happen. But the bottom line is, a visual representation of orderflow is called Footprint/Number bars, depending on the company/software provider.

Below is an example of how it looks like

So how your next question would be how is Market Profile connected with Orderflow/Footprint Charts? - The short answer is they need not be connected.

You can trade with just Market Profile concepts and Profile charts like the one below, but it makes more sense only on time frames larger than 30 mins. Below is a day wise profile. But as you can see its not really intuitive to trade based on this, its good for post facto analysis though.

Now let me confuse you a bit more, by adding one more concept - with the advent of Internet and the easy access to volume data, a related field of Volume Profile and a lot of volume based indicators came into existence. The below chart gives you both Market Profile and Volume profile in the same view. You get to see the price at which the max volume was traded as a profile (VPOC), you can also get to see Cumulative Delta Divergences another interesting volume based indicator - https://marketdelta.com/delta-divergence-chart-signals/ 

Now, each of these things, Market Profile, Orderflow Charts, and Volume Profile can be used in combination or by themselves to make a trading decision. You can mix them up and create your own system based on a combination. 

In the next part I will share my perspective on the practical use of these tools. The key is - Do they have any predictive capabilities? 

Think about it, will see you with the next post soon.

You can read the posts here and here. And some more updated info here about various vendors you can use for Data feeds and Orderflow /MP Indicators.

NIFTY - Scalping Set-up - 01 - Opening Spikes & Opening Drive

Context - As a Scalper / Day trader, mornings are very important for me. Some of you would have noticed in the room that my position sizing in the morning is at max, the reason for that is simple - The probability of range extension + linear price moves (Opening Drive) is more in the morning than in the afternoon.

Now lets delve into the specifics of a setup. Remember the moment we use the word setup you need to be sure of the following elements before hand

1. What determines entry?

2. What is the probable - max favorable excursion - reward?

3. What is the probable - max adverse excursion - risk?

4. Trade Management Approach? Is it 

a) Fixed Size Buy - Scale Out

b) Fixed Size Buy - Fixed Size Sell - All in / All out

c) Scale in - Scale Out

d) Scale in - Fixed Size Sell/All out

While we would visit each of the above issues by themselves, we will now see how visually how does the opening spikes look like and is it worth trading them? 

Look at the image below, it's a NIFTY slight ITM Strike - These are two days of Opening Spikes

Fig -1 Opening Spikes

Do you see a trading opportunity here? Scalpers typically would do their "Johnny One Lot" as Tom Sosnoff calls it here. Knowing very well that the direction of the spike may or may not be the Opening Drive. If you can afford to loose no harm in warming up with a lot or two here. Typically this Occurs between 9:16 to 9:30 IST

Next comes the main Opening Drive trade which is where we expect around 50 to 60% of the day's range to form. The high of this Opening Spike or the Day High till that time becomes an important reference for a breakout trade for the Opening Drive. Typically this occurs between 9:30 to 11:30 - Read it as 1 hour of up move + 15 mins of consolidation at top / retests of high + 45 mins of Mean reversion. The below pictured represent the above two days and their Opening Drives.

Coming to the specifics of the setup

1. Entry Criteria

You define the candle closing time, for entry, you can define anytime, like close of 9:16 candle? - esp. if you want to trade the Opening Spikes. For Opening Drive its better to wait for 10 to 15 minutes at least. So the entry for Opening Drive would be the high after 15 or 20 minutes, you can define it or take it based on momentum at that time. Whatever approach you choose, understand that this is a breakout trade and its safer to enter a bit higher instead of lower, a bit higher would mean 1 or 2 points on NF.  

Fig2.jpg
Fig3.jpg

Since this is still the open, the probability of a range extending is fairly high. (In this para I am talking from a Options Long perspective, it can be CE or PE)

Also look for any previous day's price levels which can act as support/resistances.The following are the key - Previous Day  High/Low/Close/VWAP - If you are keen you may also want to mark similar levels for the previous week - High/Low/Close/VWAP. (In this paragraph I am referring to NF Nifty Futures)

The reason its important to keep these levels as a reference, is because larger time frame traders would use these levels as references (for Buy or Stop Loss) and that may create a flush/volume spike.  

2. What is the Reward - Max Favorable Excursion?

Now that we have defined the entry criteria, the next thing we would need to know is, what is the best and worst that can happen. Lets start with the best things first. Here I would borrow John Sweeney's concept of MFE (Maximum Favorable Excursion) which mean's if the trade works in our favor what is the max gains that we can expect from it. To understand that let me take you through some back-tests that we have done.

The first / second images tell us - what to expect if the price crosses the day high or day low formed till 9:17  on Nifty Futures?

Price crosses Day High till 09:17 

Price crosses Day High till 09:17 

Since we are direction agnostic, lets see what happens when the price crosses the Day Low till 9:17 

Price crosses Day low till 9:17

Price crosses Day low till 9:17

The above data tells us what is it that we can target, obviously if you are using options as a trading instrument you would need to factor in delta of the strikes which you are trading. Nevertheless, we now how a probabilistic sense of what to expect. 

The above information is relevant more for trading Opening Spikes. In the next update to this post, I will share the MFE for Opening Drive.

When thinking about Opening Drive we need to keep three factors in mind to understand the market structure at that point in time.

1. Define a reference - In our case we will use the mean or ATP or VWAP as a reference.

2. We need to understand the mean excursion from the ATP/VWAP- Look at the chart below. Which gives us an important data point - 

This chart tells us the mean percentage of the intra day range that gets formed before 1:30am . As you can see it says 60%, if for e.g. the intra day mean (high-low) range for the index for a given period of time is 70. 60% of 70 i.e. 42 is what gets formed before 1:30pm. 

3. The next aspect that we need to determine is, how does the 42 points range gets formed (between 9:00am to 1:30am).

In the chart below, what we see is, it takes about 83.4 minutes (apox. 1.5 hrs) from 9:15am to the point of Max excursion (high or low) during the first half .

So we have 3 references to work with, a) We know the mean/ATP/VWAP at a given point of time, b) We know the mean (H-L) range that gets formed in the first half 42/25 ish. c) We know that it happens in about 1.5 hours. Creating probabilistic frameworks like this is the key to scalping, its helps us understand where we are at a given point of time and how the odds of wins stack for or against us. 

Feel free to comment and ask questions in the room. Would be happy to clarify.


Launching NiftyScalper Day Trading Room!

I am happy to let you know that we at NiftyScalper are taking the next step to bring the day trading community in India closer through our slack based NiftyScalper Trading Room.

In the past few months, the number of coaching requests were quite overwhelming, and it was taking too much of my time, on top of it I could focus only on 1 or 2 people at a time.

Also, I realized there were several people who could not afford my coaching offering, based on my interactions with a few people I realized, a Trading Room would be a much better way of bridging this gap.

So this is what I intend to offer in the room (From 6th Nov'17)

1. Live Trade Alerts - Yes its not easy to follow, but the idea is to learn from observing so that in future you don't have to depend on the alerts at all. These alerts also act as references for any questions that you may have. Apart from alerts, I also provide live observations on the developing market structure, which includes aspects like Range, Range expansion levels, Points of invalidation for positions, Mean reversion areas etc. Watching the market and the reading the updates would help budding traders connect the dots. Which over the long run would help traders develop an independent sense of the market.

Do note, that I do not use any proprietary indicators, or exclusive and expensive technologies like order-flow/footprint charts. I would perhaps share my rationale sometime soon on the blog as to why I don't see an edge in it. Nevertheless, whatever indicators and references that I use, are (almost) freely available to everyone.   

2. Discuss Trade Rationale & anything else that wold help you become better at the game - Nothing like collectively discussing set-ups and clarifying by asking questions. I may not always be an expert at everything, the group over time will have several experts with different specializations, which would help you gather the wisdom of the crowds. 

3. Discuss/Share Articles/Books - Learning should never end, and if its does, thats the end. With that perspective, the idea is to share and discuss best of the books and articles in the Day trading space

4. View Daily Performance Logs - They say, what gets measured gets managed, so the idea is to post our daily performance logs so that we know how we are doing. This is more from an indicative purpose. One may not be able to post all scalp trades, but we will post trades which can be predicted well in advance. 

5. Specially curated blog posts and NIFTY data analysis reports only for members (after commercial launch) - There is a lot of effort and investment that goes into data analysis and related strategy formation, which is what would be shared with members. I also have data scientists on retainer contracts who help with testing various set-ups. All such data and reports would be available exclusively to the members.

The larger focus of the room will always be Quant/Statistics based scalping strategies. 

Given that I would be hiring people to manage the room and other associated costs, this would be a paid service, however we would make sure the costs are pretty nominal. Initially till the end of 2017 the room would be run on a beta mode and would be free for you to access.

I am also working on creating a detailed glossary and faqs which would help you and others understand the #scalp-alert messages and other conversations better. 

Look forward to your joining the slack group and would request you to type in a short intro (Location/Trading Exp./Etc.) about yourself in the #Intro channel once you join. 

Please use the link below to join

https://join.slack.com/t/niftyscalper-tr/shared_invite/enQtMjgwODY4ODk2MzM5LTJlMDA0NDQ4N2UxYzY0N2IxMjM0YjNlYmNmNGVhZjliOTc4YzhjZmQ1MDEwM2VkODMyMDhhZjI2Mjc4ZTE3ZTE

Thoughts on Scaling into Positions

I was reading an article "Advanced Scale-In Strategies For Short-Term Traders. by David Penn"

The closing remarks caught my attention. 

Part 1

Part 1

Part 2

Part 2

This runs absolutely against the one of the golden rules of trading "Never add to a loosing position". But the more professionals I met, the more I got convinced that, like all things in life, reality and edge has its nuances. So scaling-in in a given context is perhaps a good trade management strategy.

The key is - one has to know the context in a quantified sense, which is what is highlighted in the second snapshot above. 

My back testing on NIFTY tells me, Pullbacks in the trend and Mean reversion setups are the ideal candidates for this approach. If you are new to this, remember this can be a double edged sword, but then almost everything in trading is. 

More on it that I have written previously.

Book Excerpt - Layered Position Sizing

Note to Self - Learning from Losses

George Angell and his methods of Day Trading

When I started trading, esp. day trading, a whole lot of people told me, don't do it, it's the most risky form of trading. Then when I would ask them why is it more risky than say positional trading, they would not have convincing answers. That was a good starting point for me to build my conviction around the possibility of success in intraday time-frame. 

Likewise, when I started studying technical analysis, I was always surprised by the way traders at large perceive it, to be a predictive tool. If there is a crossover buy or sell. But they never told me why should the price move further if there is a crossover. That uncertainty brought me to the fundamentals, i.e. time, price and probability. 

So in my search for people who view the market price action in these fundamental ways, I chanced up on George Angell. You can search more about him and his books, but here I am going to post a selection of videos which he did I guess in the 90's. Its a part of a larger series and I would recommend you watch most of them.

What to look for and be mindful of when watching the videos?

1. Focus on the larger contexts and broad methods, not really the specifics.

2. His definition of "Scalping" is different from how I refer to the word. Over here I use the Tasty Trade definition. Keep that in mind as he may come across as if he is against scalping.

3. His methods are pretty relevant to NIFTY and its nature/market structure, hence good to back-test the ideas if you are serious about using them. His recommendations about order execution may not be relevant as NIFTY is far more liquid today than what ES/S&P would have been then.

The first video explains the fundamentals of price and time. You will understand the causes of price movements. Why you get pullbacks? Why does a breakout happen? Understanding price equilibrium? Side note - He looks at 1 min. bars.  Notice his emphasis on "Time" - How long does it take to get from point A to B, something most people overlook.

The second video is on day trading - Here he talks about the advantages of day trading and a lot more. In fact there is a series of videos that he seems to have done on the topic of day trading, watch them all. Most of what he says is absolutely right. 

Lastly, don't take anyones word (including mine) when it comes to what works and what doesn't. Think for yourself, apply your mind, try, experiment. At some point that "ah ha" would happen. 

Article Review - Intraday Path Length | Kim Zussman

While rummaging through the http://www.dailyspeculations.com/ blog some time back, I landed on this gem.

Just read it. Re-read it, and try adapt it to NIFTY, you would see immense value in it.  I've always intuitively used the concept of "Path Length" in my trading, didn't know its something which the biggies also look at.

http://www.dailyspeculations.com/wordpress/?p=2507

http://www.dailyspeculations.com/wordpress/?p=2507

Tuesday evening musings - Learning from the master

I've always been interested in the skills development space, more specifically in the context of crafts. In my attempt to dig up more literature in that area, I came across two books. One, is 'Shop Class as Soulcraft: An Inquiry Into the Value of Work by Matthew Crawford' and the other is 'The Craftsman by Richard Sennet'. Both excellent reads for those looking at understanding the virtues and value of manual work.

Getting to why I got to write this post. This morning while coaching one of my students, a sharp boy I must say, asked me very specific trade execution related questions and I was pleasantly surprised and glad that he did. He was one of the first among perhaps, 50 odd people who I have coached, to ask such questions. That's when I was reminded of what Sennet says in the book while describing how people learnt in Antonio Stradivari's workshop.

    Page 78, The Craftsmen

    Page 78, The Craftsmen

What I learnt from Victor Neiderhoffer | Article Review

I have been a fan of Victor Niederhoffer for a long time. What a talented multifaceted man. If you are into trading or any kind of speculative business you've got to read his books.

I read this (https://www.newyorker.com/magazine/2007/10/15/the-blow-up-artist) article about him and thought of sharing some interesting snippets.

1. Experience in some sort of Performance Sport - I do think it helps to have had played a sport or done any performance related thing like Music etc. The reason I think its relevant is from a skill development perspective. All forms of sports or crafts require a progression of skill levels. It also requires us to observe, reflect, deconstruct, attempt and practice tasks. 

Capture_1-Sport.PNG

2. Discipline, avoiding noise and focusing on Short term moves - Being on time I guess is the first aspect of discipline, alludes to the idea of routines and their importance in success. The second aspect is avoiding noise, as a trader you need to have confidence in your system and approach and you need to avoid noise i.e informational noise. Thankfully I quit TV a decade back, and have never gone back. Lastly, look at that focus on "Short term moves". I have always been against the Random Walk/Fama school, and have been more of a Mandelbrot follower. Good to see the same beliefs at play here. 

Capture_2-Trading Style.PNG

3. Market Statistics as an Anchor - It always helps to know how things worked in a similar context in the past. The reason it helps is because prices in the short term are nothing but a reflection of the emotions of people, and that does not change.

Capture_3-Trading Style_Statistics.PNG

4. I told you so! If someone tells you that day trading does not work, its because most traders do not have the skills to make it work, but by itself patterns in shorter periods are far easy to predict than in longer periods.

Capture_4-Trading Style_shortterm predictability.PNG

5. RIP - Efficient Market Hypothesis and Random Walk Theory - The moment you shorten your trading time frame, you will start to see the inefficiencies. If you are a trader reading this, think about Open Close as a separate event and High Low range formation as a different event, and you will see the inefficiencies clearly.

Capture_5-against RMH.PNG

Lastly, understand where risk comes from, I mean risk of ruin. While there is always a defined risk with which we take trades, risk of ruin typically comes from the possibility of an unforeseen event happening and you having no control over it. Read that statement again, the second part especially.

Now think about how to avoid being in that situation, that should be good enough to keep you going in this business.

Happy Trading!

Scalping as a Skill | How to Practice Deliberately

If you look at learning to Scalp - It has three components to it - Knowledge, Skills and Attitude. While Knowledge is something which is relatively easy to pick up, and may not take much time, its the other two components that take more time. Like any other skill, practice is an important component of it. You need to trade for a long period of time to gain expertise. 

One of the reasons why "Scalping" experience is preferred in several Prop Desks, Arcades and Trading Desks, is because Scalping is one way of accelerating the learning cycle by trading more. Yes it may seem counter intuitive to some, but think about it. The act of identifying levels and punching in orders, multiple orders sometimes, modifying them, and doing all this in an emotionally charged environment, not easy. Scalping helps you desensitize yourself from these emotional highs and lows as you would get to expose yourself to it several times in a day. This is the point where practice starts influencing your personality and attitude. 

I don't know of any successful trader who has not been though this cycle.  

But more importantly one has to structure ones practice. This video helps us understand the idea of deliberate practice better. Do watch it till the end, almost everything shared in the video is applicable to the world of trading and scalping.

Dissecting Momentum | NIFTY Intraday Scalping

One of the turning points in my trading journey was the time when I stopped predicting direction. It doesn't come easily and naturally. Needs a bit of conditioning but once you get through it, your cognitive algorithm works like a charm. It moves from a binary to a bayesian mode. 

Let me illustrate the two ways of thinking and how it manifests in the words that we use.

Trader 1 - Oh it has moved beyond this level now its not going to come down, its going to continue in that direction itself.

Trader 2 - The price may go up or down, if it goes up it should go till this point, and if it goes down it should go up till this point.

Notice the difference in thinking. Trader one is thinking in more or less a Binary way, there is no nuance there. Trader 2 is bayesian according to me. Because there are multiple outcomes each specified with a different confidence level. 

Let see how this can be applied to scalping 

Look at Figure 1 below. This is a 1 minute TF chart with the Green Line being the VWAP. Look at the last few candles, where do you think the price is headed? Obviously looks as if its going down.

Figure 1

Figure 1

This is a 1 minute TF chart with the Green Line being the VWAP. Look at the last few candles, where do you think the price is headed? Obviously looks as if its going down. Now look at Figure 2 below.

Figure 2

Figure 2

Such shifts are part of everyday price action, the only way to deal with them is to define "Trade Validation/Invalidation Levels"

That brings us to the topic of Momentum. Momentum has two parts to it a) Direction b) Speed. When scalping you cannot predict direction. What you can do is to take a probabilistic call on two things 1) Possible extent of move from a given reference point. ( This needs to be arrived at based on back-testing) 2) Volatility - Which is similar as 'speed' of the move. (Which again can be arrived at by back-testing for time intervals with high volatility)

In this case VWAP would be your reference level, the points marked in red (Figure 2) would be points of validation or invalidation depending on the direction that you are trading. Based on which you would also have to create a Risk Reward ratio to trade in such locations.

So the idea of this post was to explain why its futile to predict direction, instead its better to go with the probabilities and bank on volatility to get you to your targets. 

Also remember there are times when price would get to the point of validation and invalidation and still may reverse from there, what do you do then, I will leave it for another day.

Happy Trading!

Why 95% of traders fail? | Perspectives on that statistic

A few weeks back I had answered a question on Quora?

https://www.quora.com/If-only-5-traders-can-make-consistent-profits-in-the-share-market-what-qualities-and-skills-make-them-unique-to-achieve-these-types-of-results/answer/Sandeep-Rao-7

Incidentally came across another article on the same theme here - 

https://breakingoutbad.com/2017/09/03/bullshit-95-of-traders-fail-trading-is-gambling/

Good to see someone else endorsing the same ideas. I will leave you with a few excerpts.  

Something I said in the answer. In fact good traders have a very high demand in the industry, more so in India. I personally know people willing to hire mature/responsible traders with a proven track record.

Something I said in the answer. In fact good traders have a very high demand in the industry, more so in India. I personally know people willing to hire mature/responsible traders with a proven track record.

One thing that people need to understand is, growth in any business including trading can be exponential, which a 9 to 5 job can never provide. But getting to the point of inflection, could take time. That is the test, perhaps. Can you hold on till …

One thing that people need to understand is, growth in any business including trading can be exponential, which a 9 to 5 job can never provide. But getting to the point of inflection, could take time. That is the test, perhaps. Can you hold on till that point, or would you quit before that. Choice is always yours. 

Understanding NIFTY Market Structure | Time of Day

In continuation with the previous article about NIFTY Volatility based on time of day, here is another simple way of understanding the market structure of NIFTY.

Previous article - https://www.niftyscalper.com/blogs/2017/8/8/article-excerpt-niftyscalper-data-analysis-fundamentals-of-short-term-trading-part-two-dr-brett-n-steenbarger

You can create a simple excel sheet to capture the following details, Time stamp for - High, Low, and Mean Reversion of the day. I have categorized time as 1st hour (FH)/last hour (LH) and Mid Day (MD). You will see a pattern here, and over time you may be able to internalize this pattern.

 As an Intraday trader I am direction agnostic here, and as you can see there are only 4 types of days. And yes for the best part, look at the Mean Reversion column, it speaks for itself.

xl.PNG

Combining this with NIFTY Range probabilities should help you improve your ability to make short term forecasts of market direction.


Note to Self - Understanding and leveraging one's Body Clock

This thing has been running on my mind for long. I have reflected a lot on this too.

My thoughts are specifically about three activities which are key to my lifestyle.

1. Work i.e Trading - I cannot do much about the timing here, its fixed. But Yes I know I am a better trader in the mornings.

2. Creative Work - This includes blogging, writing, reading, and every thing else that I do. Early mornings 5 to 6 works best here for me. For work such as carpentry etc. weekends are best.

3. Exercise/Running - Here, I need a bit of glucose in my body, perhaps a cup of coffee and I am good to go. I have observed my ability to exercise in the mornings anytime between 6 to 8 is far far better than any other time slot. 

With these three things sorted, I plan all other activities in the leftover time slots. This is obviously a work in progress. 

I still remember one of my colleagues at work used to talk about Cognitive time vs. Chronological time, only now I have been able to grasp as to what he was alluding to.

Book Review - High Profit Trading Patterns by Kora Reddy

For a while I have been on the lookout for a book on Indian Indexes. Recently a fellow trader recommended this book and I thought of giving it a read. Thanks to my dyslexia I am not a big reader of books, but given that I didn't have any choice here, I thought of reading it.

Before I share my thoughts on the book here are a few excerpts from the book which resonated with me.

1.jpg

I only wish people understand this fact about indicators. 

2.jpg

As Larry Williams says, patterns form because of the way humans/human emotion reacts to the price, and human reaction of greed and fear does not change. 

3.jpg

I have spent months and months looking at footprint charts to see if it could give me a edge in scalping, and I didn't find any. Took some time to realise that price by itself is good. 

4.jpg

This one is gold according to me, I think this is something I share with all developing traders that work with me.

With the excerpts covered here are my thoughts on the book.

  • This is a first of its kind, in terms of a book which uses NIFTY 10 year historical data to analyze price patterns.
  • Very objective and measured in its approach. 
  • A good primer to understand NIFTY
  • A good start to get ideas about testing NIFTY data and creating your own trading set ups.
  • A must read for anyone trading NIFTY on any time frame.

Here is the Amazon link for you, i.e if you want to buy the book. High Profit Trading Patterns Paperback – by Kora Reddy

Request - For heavens sake don't photocopy this book or buy a pirated version. That's the best way to dis-incentivize more people from writing a book. 

Article Excerpt & NiftyScalper Data Analysis - Fundamentals of Short-Term Trading : Part Two | Dr. Brett N. Steenbarger

Ever since I began my journey in the world of trading, articles and books by Dr. Steenbarger has been of great value to me.

Coincidentally I came across this excerpt where he is alluding to the idea of looking at markets horizontally, something that one of my team members' tried analyzing sometime back. First things first, here is what Dr. Steenbarger has to say.  

Article link - http://www.brettsteenbarger.com/Short-Term%20Trading2.doc

All the seasoned day traders that I have interacted with, either intuitively or through analysis, have said the same the thing, ie Not all time slots are the same.

Lets look at the volatility spikes on an Intraday basis for NIFTY. This was 2 years data, and we tried to do the same horizontal analysis by normalizing each day's move. You would clearly see two peaks and a trough. Of course this does not give a nuanced picture as a Monte Carlo analysis would, but still tells us quite clearly where the "meat" is. 

On a closing note, I was once told by a developing trader that he take trades only after 10:15 am IST in NIFTY, as he "believes" that's when you get an opening range breakout. Needless to say, he would get stopped out more often than not, and perhaps would see his trade move in the intended direction, couple of hours later. 

A simple horizontal analysis can help you time and size your trades optimally. Try it out.

Note to Self - Learning from Losses

There are three things I learned from loosing, ie. taking losses, sometimes large losses. 

1. Personality Fit - I realized what kind of trading style fits my personality, to what extent am I comfortable taking losses. That is when I became damn sure, that it has to be scalping/Intraday trading for me. I cannot think of overnight positions and managing those positions first thing in the morning. I also realized I do not like taking losses once the trade moves in my favor.

2. High Probability Set-ups - Now this one, is learnt better when losses happen consistently in certain set ups, for me it was Mean Reversion Trades + Scaling-in which used to cause disasters.  I thought about it and found quite a few solutions to the problem. Usually if a set up is consistently failing, the reverse of that should be profitable, and that worked for me. I also realized the potential risks of averaging down, and the context in which it works. 

3. Money/Profits are fungible - This one becomes relevant when you make up the losses that you made. The whole process of loosing and then making it up, gives you a sense of confidence, it also helps you compare and contrast your own approach to trading then and now. Lastly, It makes you more open to taking defined risks.

So here's my thank you to 'Losses' that I made. I am glad you came.

Book Excerpt - Layered Position Sizing

While a lot of popular texts in position sizing and trade management say, don't ever add to a loosing position, I realize that like everything else in life, there is some more nuance and context to it.As I delve deeper, read and listen to more professionals, I am getting contradictory views on that.

There seems to be some merit in scaling-in (averaging down) and scaling-out of positions. I am reading this (http://www.amazon.in/Prop-Traders-Chronicles-Short-Term-Proprietary/dp/1118241088) book currently and found this interesting excerpt.

Note to Self - Full-time trading & freedom

Was speaking with some friends over lunch today, and they asked me as to why I choose to be an entrepreneur, yes that is how they look at full time trading. My immediate answer was "freedom". 

One of them then asked, why does one need so much freedom, in other words what's the use of that freedom. That is something I was being asked for the first time by someone. This time around, I thought for a few minutes and said "Freedom to spend as much time as I want to, on becoming better at my chosen vocation"

Note to self - “Freedom makes a huge requirement of every human being. With freedom comes responsibility. For the person who is unwilling to grow up, the person who does not want to carry his own weight, this is a frightening prospect.”― Eleanor Roosevelt 

Meditations on Screen-time - Part 2

In the first part, over here - Meditations on Screen-time - Part 1 we talked about what is it that one needs to do while looking at charts, the first aspect that we focused on was the difference between Seeing and Observing. 

In this post we will move further and see what is it that we can do with what we have observed.

By observation we collect data or information about whatever we are observing, we may be looking at a 1 min time frame chart or a 5 min time frame chart, or perhaps a footprint chart, it could be anything that is contextually relevant to you. Over time with note taking and reflection, you would have a lot of this information in your mind, what the psychologists call "Crystallized Intelligence". 

The next step is to put this observed information to use, by making inferences (Fluid Intelligence). There are two ways to look at the concept of "Inference" one is - as a plausible explanation about an observation (The Why), the other way to look at inference is the way Bayesians use it, for them Inference-ing is about thinking in terms of probability distributions, and updating the values we assign to the distribution as we come across new evidence. If that is too much to handle, let me try to simplify it with an example.

Let's say you have been observing the breakout in NIFTY the moment it crosses Day High, there are few ways to cognitively process this information -

a) You can think of "causes", meaning why is the price shooting at the point. You may deduce that perhaps stops are getting triggered etc. - This is an example of the first type of inference. No harm in doing this, the only limitation is, a lot of times its more difficult to find causes than correlations, and as a trader you know whats more important.

b) You can think in terms of "averages" - You may deduce that usually it shoots up by 10 points and keep that as a reference. This is good but then "averages" are not that precise as we know, and more importantly does for help build a framework/scaffold on which one could build a sort of model as more data/evidence is observed. That brings us to the third way.

c) You can think in terms of "Probability Distributions" and "Conditional Probabilities" - Every time you observe the breakout you could create an imaginary distribution.

For instance keep one can keep the following exponential distribution in mind (look at it more from a visual perspective rather than for it's mathematical accuracy)   

Now imagine, putting all your observations on the curve, perhaps adjusting the curve based on observations. That would get you to think about the outcomes more from precisely. You may be able to tell yourself, if Day High crosses we will get 2 points for sure, I am 90 % confident about it. 

Now add to this some "Conditional Probabilities" - Lets say you also observe that on days were you get a range beyond X in the first half of the day the above distribution no longer remains valid.  Now what you have done is you have found an exception to the above rule. Over time you would be able to "cognitively" add several such conditional exceptions as well to your inference. 

I hope the above example helps you visualize outcomes in a more structured way. If you are more interested in the Bayesian way of thinking about situations and outcomes you may want to start here. 

https://www.farnamstreetblog.com/2012/12/thomas-bayes-and-bayess-theorem/

So at the end of it, all the time you spend in front of the screen, watching price action and charts should help you create a probabilistic framework in your mind, and the more you gather evidence the more you should be able to refine your "confidence levels" of the outcomes.

As always happy to hear more form you.